IMPORTANT! The STC measurement is only a partial insight into real-world satisfactory performance. It is an incomplete measurement since STC ratings do not factor low-frequency bass, which is where most noise problems occur.
Please don’t rely on STC values alone when specifying a soundproofing system. We've learned that a high STC-rated wall may suffer terribly in the low frequencies and is therefore not a true solution.
An effective soundproofing system will perform below the 125Hz STC frequency cutoff.
What is measuring STC good for?
Sound vibration decreases as it travels from one side of a wall to the other. To understand the value of STC ratings, we need to quantify and measure this loss.
Understanding STC can be valuable, but what really matters is whether your choice of soundproofing solution actually works.
Expensive, exotic building materials don’t generally help much, though they sound great on paper. Mass-loaded vinyl, resilient channel, “soundproof drywall,” “sound board,” “soundproof insulation,” and fancy isolation clips all promise to solve even your worst soundproofing problems, but in and of themselves, they don't always.
For good soundproofing results every time, stick to the inexpensive basics:
Essential Decoupling
Mass added from inexpensive 5/8” drywall
A competent Damping Compound
What is STC?
Sound Transmission Class (STC ) is an integer rating of how well a building partition attenuates airborne sound. In the USA, it is widely used to rate interior partitions, ceilings and floors, doors, windows and exterior wall configurations (see ASTM International Classification E413 and E90).
In short, STC gives you a rough idea of how much sound a wall, for example, might stop. STC is the most common sound reduction measurement in use. As common as this measurement is, it is quite limited and should not be totally relied upon for real-world soundproofing expectations.
Sound Transmission Basics
DECIBELS: A decibel (dB) is simply a measurement of how loud a noise is. Think of dB as the volume knob on your receiver. 50 dB is quiet while 140 dB is so loud it can immediately injure your ears.
TRANSMISSION LOSS is a measurement of the dB (volume) difference on either side of a wall. Let's say we have a 100 dB tone on one side of a wall. Pretty loud. We measure this same tone on the other side of the wall and find we have 75 dB. So we would say that at this tone or pitch, we have 25 dB Transmission Loss. 25 dB less sound energy made it through the wall to the other side.
FREQUENCY, written as Hertz or Hz, is the measurement of the tone or musical note of a sound. It might have a high pitch like a flute might make (2000 Hz) or a low pitch as from a tuba (as low as 29 Hz).
Most humans are born with the ability to hear frequencies from about 20 Hz (low) up to 20,000 Hz (high) but that range shrinks as we get older.
Interestingly, a test tone with a different pitch sent through that same wall might only see a 4 dB transmission loss. The performance of a wall will vary greatly, depending upon the tone (frequency) of the sound.
What are STC ratings?
In 1961, STC was introduced as the method for comparing various wall, ceiling, floor, door, and window assemblies. STC is calculated by taking the Transmission Loss (TL) values tested at 16 standard frequencies over the range of 125 Hz to 4000 Hz and plotted on a graph. Your curve (what you actually measured) is compared to standard STC reference curves (see appendix). If your wall graph is closest to a standard STC 35 curve, your wall is said to have an STC rating of 35.
Adding Green Glue to boths side of a wall.
The magenta line in that graph is the standard reference STC contour.
The green line is the performance of the wall.
To calculate Transmission Loss and STC, the performance data should be obtained from a certified laboratory.
Higher STC is generally better, though not always, as we will see below.
Caution: The largest problem with relying on an STC number alone is that STC only considers frequencies down to 125 Hz. This can be misleading because most sound isolation complaints are from noise sources that are below 125 Hz.
Examples of noise sources below 125 Hz
Most of the sound energy generated by the average home theater
Traffic noise from airplanes, trucks, and heavy equipment operation
Guitar, bass, drums
Industrial equipment, especially pump system
Comparing two walls STC (in this graph, higher is better)
The example above demonstrates the problem with not considering data below 125 Hz. Frankly, neither of these walls stop much sound. Both are mediocre, with a low-frequency problem near 125 Hz. However one wall is STC 32, the other is STC 42!
This is because, with the blue wall, the big problem occurs at 125 Hz, and is therefore measured by STC. The black wall has essentially the same problem; however, it occurs just below 125 Hz and is therefore not calculated.
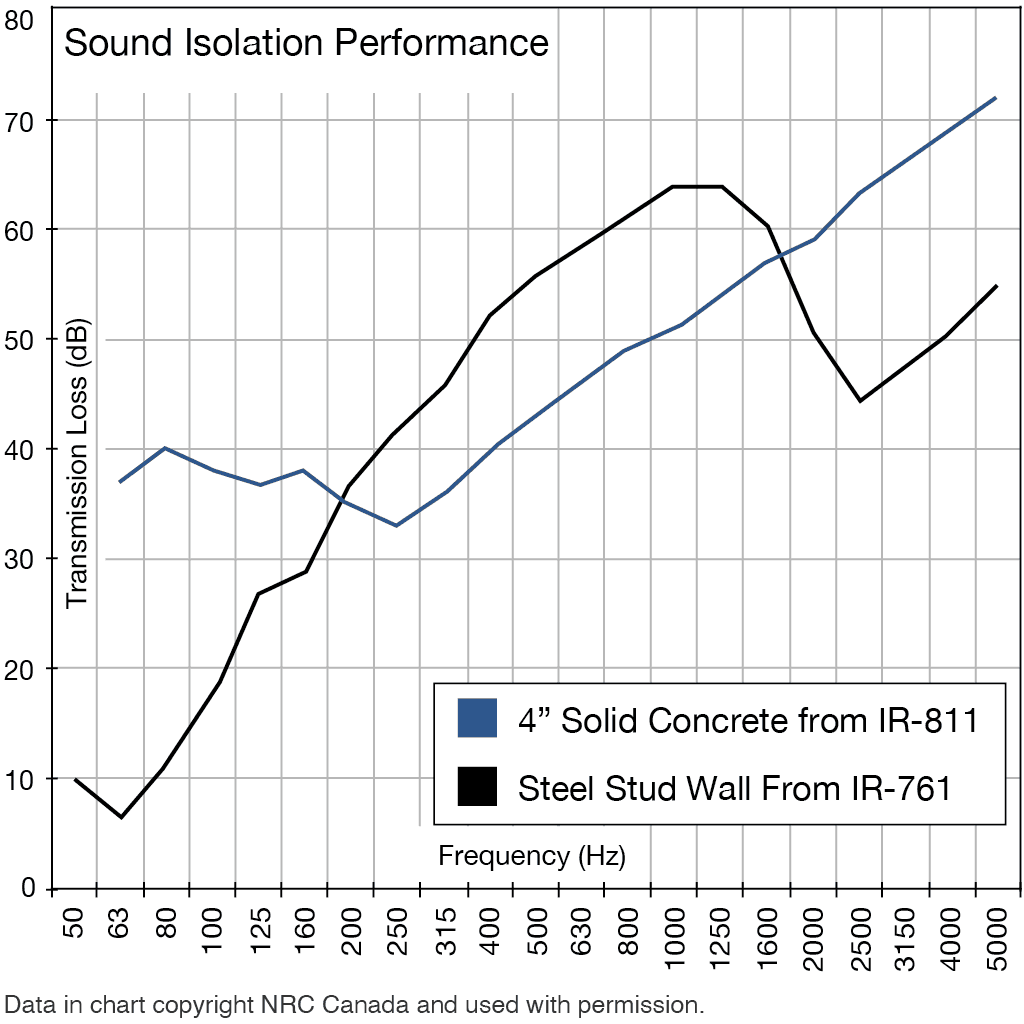
Don't rely on STC alone when low-frequency noises are present
We see two walls. One has an STC 47 (4" Solid Concrete), the other an STC 48 (Steel Stud Wall). Note that in the low-frequency range - important for music, theaters, traffic, aircraft, and most other real-world noise sources - the lower STC wall is literally 30 decibels better, yet lower STC.
The actual 1961 standard which explains how to calculate STC (ASTM E413) describes the limitations of its use: "This single-number (STC) ratings correlate in a general way with subjective impressions of sound transmission for speech, radio, television, and similar sources of noise in offices and buildings.
This classification method is not appropriate for sound sources with spectra significantly different from those sources listed above. Such sources include machinery, industrial processes, bowling allies, power transformers, musical instruments, many music systems and transportation noises such as motor vehicles, aircraft, and trains. For these sources, accurate assessment of sound transmission requires a detailed analysis in frequency bands."
Caution: STC is not a measure of how many decibels of sound a wall can stop. If you have an STC 45 wall, this does not mean the wall stops 45 dB of sound.
Caution: You cannot add STC ratings. They are logarithmic values and cannot simply be added. If you have an STC 33 wall and decide to add another sheet of drywall with an STC of 20 you do not get a finished wall with an STC of 53. You might get something around STC 35.
STC Examples
STC
Track Application
25
Normal speech can be easily heard and understood
30
Loud speech can be easily heard and understood
35
Loud speech heard, but not understood
40
Loud speech now only a murmur
45
Loud speech not heard, music systems/heavy traffic noise still a potential problem
50
Very loud sounds such as musical instruments or a stereo can be faintly heard
60+
Excellent soundproofing
Wall Assembly STC Performance
STC
Assembly Build
Performance
33
Single layer of 1/2" drywall on each side, wood studs, no insulation (typical interior wall)
Poor
44
Double layer of 1/2" drywall on each side, wood studs, batt insulation in the wall
Poor
52
Single 5/8" drywall on one side, double 5/8" drywall and Green Glue on other side wood studs
Good
55
Double layer of 1/2" drywall on each side, on a staggered wood stud wall, batt insulation in the wall
Fair
60
Double 5/8" drywall on either side of a steel stud wall with insulation and 1 load of Green Glue both sides.
Good
62
Double 5/8" drywall on either side of a steel stud wall with insulation and 2 loads of Green Glue both sides.
Excellent
63
Double layer of 1/2" drywall on each side, on double wood/metal stud walls (spaced 1" apart), double batt insulation
The International Building Code (IBC) requires lab-tested STC 50 for walls, floors, and ceilings for new construction.
Note that this is a minimal amount of isolation and you will likely be disturbed by neighbors. Better to look at STC 55 to STC 60 for best satisfaction.
Changes in STC Rating
Changes in Apparent Loudness
+/- 1 STC points
Almost imperceptible
+/- 3 STC points
Just perceptible
+/- 5 STC points
Clearly noticeable
+/- 10 STC points
Twice (or half) as loud
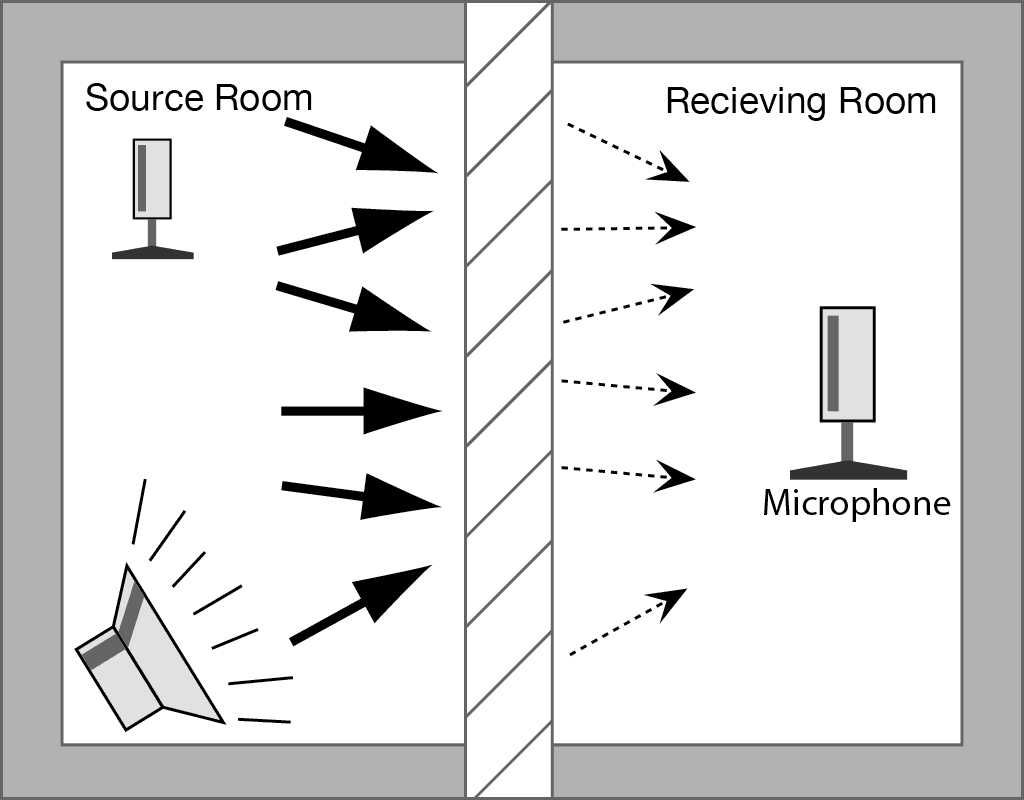
This graphic shows how noise is generated in one room while the sound pressure levels in decibels (dB) are measured in both rooms at 16 distinct frequencies between 125 Hz and 4,000 Hz. The difference in levels is corrected to account for the acoustical properties of the receiving room.
We are looking for the Transmission Loss at these 16 frequencies (see table below). This is ASTM E90 Standard Method for Laboratory Measurement of Airborne Sound Transmission Loss of Building Partitions. The Sound Transmission Class (STC) is determined in accordance with ASTM E413, Classification for Rating Sound Insulation.
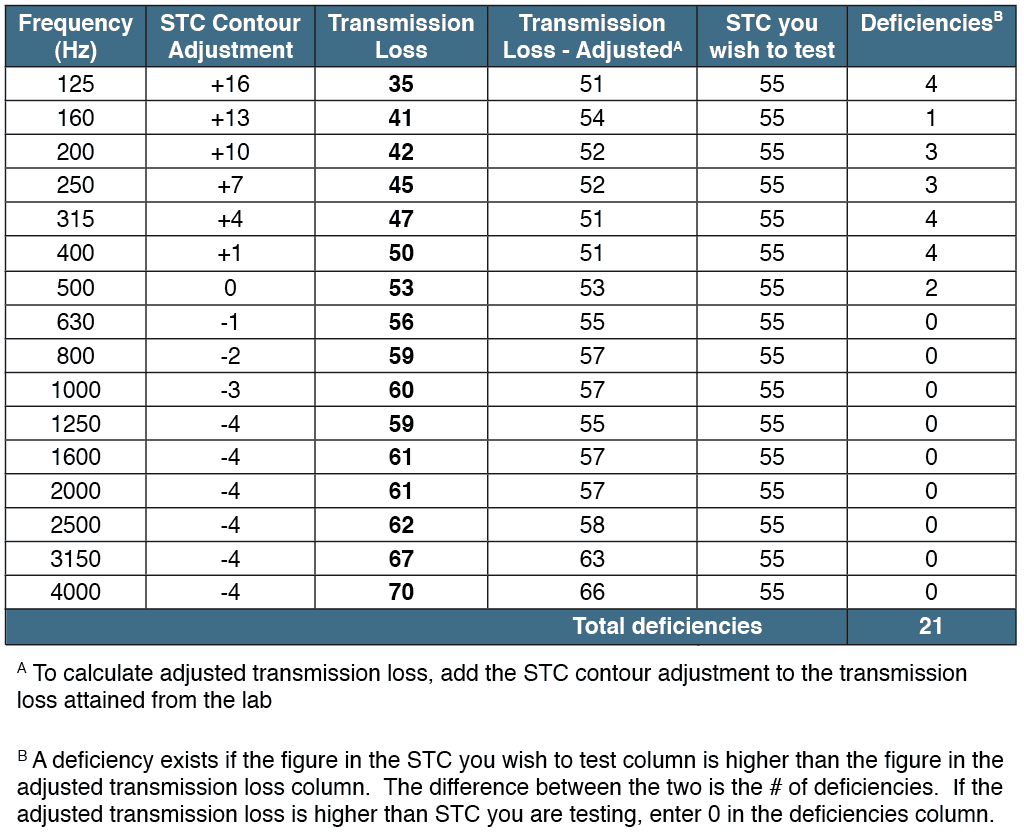
Calculating STC involves adding something called "deficiencies" and utilizing the STC contour In the table you supply the Transmission Loss data. Then you add the STC contour adjustment to attain the adjusted transmission loss. Then you basically play with numbers in the "STC you wish to test column" until one of the two limiting conditions listed below are met. The highest number that satisfies both of those conditions is the STC.
The two STC conditions:
No single frequency band may have more than 8 deficiencies
The total deficiencies may not exceed 32
In the case above, the highest # of deficiencies in any frequency band is 4, and the total deficiencies are 21. So both condition 1 and condition 2 are passed. The appropriate thing to do in this situation is to raise the STC you are testing to 56. In this case, the wall would pass again at STC 56, as shown:
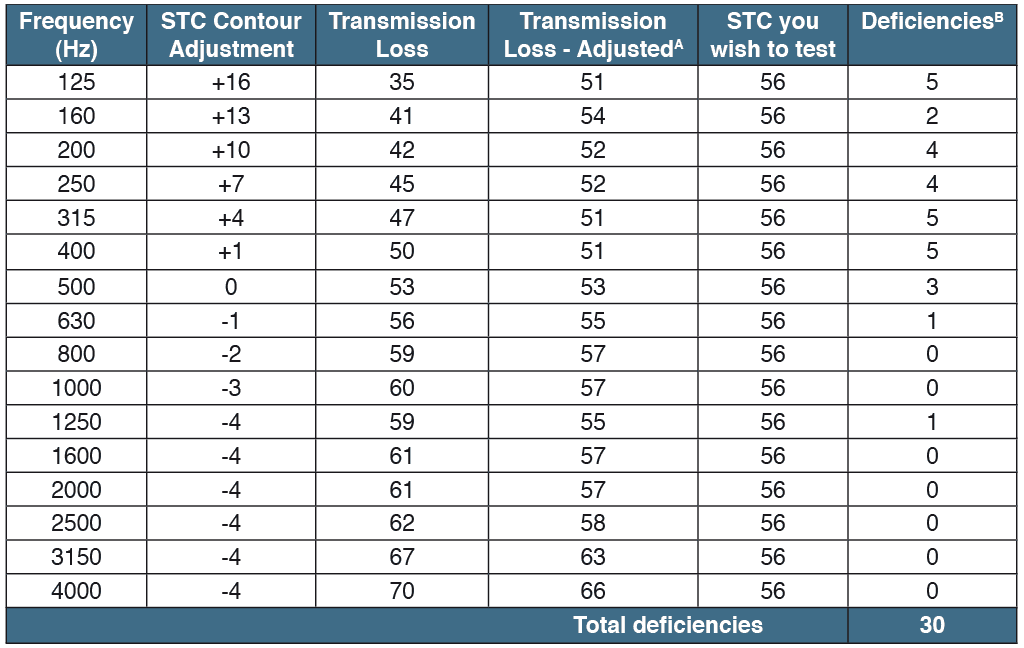
Now the total deficiencies are 30, and it is clear that if we raised the number we wish to test to 57 that the number of deficiencies would exceed 32, and thus the wall could not pass at 57.
Therefore, the STC of this wall is 56.
Finally, to accommodate the fact that human hearing is more sensitive to some frequencies than others, an equal-loudness contour is applied to the frequencies tested. This accommodation is known as A-weighting.
In general, low-frequency and high-frequency sounds appear to be less loud than mid-frequency sounds, and the effect is more pronounced at low levels, with a flattening of response at high levels. A-weighted frequencies are measured in units called Phons.
The Soundproofing Company wants to make sure your job is done right the first time; that's why it's important that we talk before you choose your products. These consultations are part of our service and are offered at no cost to you.
We have the lab reports, materials, diagrams, SIMS (Soundproofing Installation Manuals), and experience you need.
SINCE 1999 - The Soundproofing Company has over two decades of experience with soundproofing.
FREE CONSULTATION - Buy products with confidence. We know what works and the myths you should avoid.
CALL ANY TIME - Full phone support throughout the construction phase of your soundproofing project.
FULLY ILLUSTRATED MANUALS with material purchase (SIM). Detailed guides to give to your contractor.
CUSTOM FREIGHT QUOTES - Our shipping department knows how to get your order shipped to you quickly at the best price.